STA1005 - Quantitative Research Methods

Lecture 1: Statistics, Research Papers and Me

Damien Dupré | DCU Business School

1. General Information

About Me

Since 2019, I have been teaching Data Analytics and Statistics at DCU Business School.

Who are you?

Please introduce yourself:

  • What is your first name?
  • Which school are you in?
  • What is your Ph.D about (in a few words)?

What to Expect?

This lecture focuses on a new way to teach statistics:

  1. Understanding the basics

  2. Using open source software/coding language (JAMOVI and R)

  3. Applying these knowledge and skills to research papers writing

In the end, I want you to become a Data Scientist with enough knowledge and skills to:

  • Challenge bad science and wrong ideas

  • Apply to Data Science positions

Helpful Readings

Details on the Assignment

Based on your research topic, I will provide real data in April. Your task is to write a research paper publication-ready with:

  • A concise introduction and literature review with a few references leading to your hypotheses
  • A method section describing the variables, a representation of the model, and the equation testing the hypotheses
  • A results section of publication quality, including hypothesis testing and conditions of applications
  • A brief discussion and conclusion

Details on the Assignment

  • This paper will have a maximum of 6 pages and a publication ready design.
  • The deadline is June 21st, 2026.

🛠️ Your Turn!

If you haven’t done it already, can you look for the quantitative academic journal paper which is the closest to your Ph.D.

You need to download the pdf version of this paper and to send it to my email damien.dupre@dcu.ie .

Warning:

  • This paper should not be one of yours if you already have published some
  • This paper should include a statistical analysis (i.e., Regression analysis, ANOVA, \(t\)-test) and if possible the corresponding \(p\)-values

2. Statistics and Research Papers

Anatomy of a Paper

The shape of the contents of the research paper resembles an hourglass:

Starts wide (introduction),then narrows (hypotheses, method and results) and finally opens (discussion and conclusion).

A Closer Look at Papers

  1. Introduction outlines the research question and identifies the variables under investigation.
  2. Literature Review explains how these variables are connected, presents the theoretical model, and ends with the hypotheses to be tested.
  3. Methods details the variables and the mathematical equation that represents the model and includes the tests for all hypotheses.
  4. Results report the numerical outcomes of the hypothesis tests.
  5. Discussion and Conclusion interpret these findings and highlight the study’s strengths and limitations.

Essential Concepts to Master

In research outputs, all sections are linked:

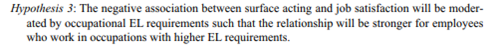
flowchart LR
  A[Introduction] --> B[Literature<br>Review]
  B --> C[Methods]
  C --> D[Results]
  D --> E[Discussion &<br>Conclusion]

To understand the statistics in the results section it is essential to identify the concepts presented in each section:

flowchart LR
  A[Introduction] -- Variables --> B[Literature<br>Review]
  B -- Hypotheses --> C[Methods]
  C -- Model &<br>Equation --> D[Results]
  D -- Statistical<br>Test--> E[Discussion &<br>Conclusion]

Thus, it is essential to master the concepts of Variable, Hypothesis, Model, and Equation before the actual Statistical Test.

3. The Introduction: Variables and how to find them?

Academic Papers’ Introduction

An introduction is a section presenting your variables and why you investigate them.

There is little reference to previous academic research, just a description of actual facts.

How to start an introduction?

  • Method 1: Number (e.g., In 2022, the average gender pay gap in Ireland was 9.6%.)
  • Method 2: Event (e.g., In 2024, the Disney company agreed to settle a class-action after female employees in California accused it of systematically paying women less than men in comparable roles.)
  • Method 3: Quote (e.g., “The existence of a gender pay gap […] points to enduring inequality in the valuation of work.” (Goldin, 1990))

Academic Papers’ Introduction

It should end with your Research Question, a question that includes all the main variables investigated which wonders about a potential relationship between them.

For example:

  • “What is the relationship between Job Satisfaction, Salary and Gender?”
  • “How does sales experience influence the performance of sales managers and sales representatives?”

What is a Variable?

A variable itself is a subtle concept, but basically it comes down to finding some way of assigning numbers or characters to labels.

For example:

  • My height is 183 cm
  • This morning, I had a large coffee
  • My gender is male

The bold part is “the thing that varies” and the italicised part is “the value of the variable”.

Let’s collect more data about our classmates on these three variables: height, coffee and gender!

Warning:

  • The variable variability corresponds to how numbers or characters according each observation.
  • Each variable has a Role and a Type, it is essential to learn how to identify them.

Type of Variables

Type of Variables

Variables can have different types:

  • Categorical: If the variable’s possibilities are words or sentences (character string)

    • if the possibilities cannot be ordered: Categorical Nominal (e.g., \(gender\) male, female, other)

    • if the possibilities can be ordered: Categorical Ordinal (e.g., \(size\) S, M, L)

  • Continuous: If the variable’s possibilities are numbers (e.g., \(age\), \(temperature\), …)

Type of Variables

Jamovi, our first statistical software, illustrates them with recognisable icons:

Warning

Variables can be converted to either Categorical and Continuous but it is always better to keep them in their correct scale.

Role of Variables

Predictors, Outcomes and Controls

It’s important to keep the two roles “variable doing the explaining” and “variable being explained” distinct.

Let’s denote the:

  • Outcome is the “variable to be explained” (also called \(Y\), Dependent Variable, or DV)
  • Predictor is the “variable doing the explaining” (also called \(X\), Independent Variable, or IV)

Predictors, Outcomes and Controls

Statistics is only about identifying relationship between Predictor and Outcome variables also called effect:

An effect between 2 variables means that the changes in the values of a predictor variable are related to changes in the values of an outcome variable.

Control Variables

Variables not included in the model OR in the hypotheses but they are in the equation. They are used to remove an irrelevant explanation of the variable changes.

Predictors, Outcomes and Controls

The objective is to find the best predictor variable(s) to predict the variability of the Outcome!

One predictor is simple to handle, but using more than one requires more understanding!

Outcome’s variability is a birthday cake

  • If 1 guest eats all the cake: 1 predictor explains all the outcome.
  • If 1 guest eats a slice of the cake: 1 predictor explains only part of the outcome.
  • If more than 1 guests, they will all eat a slice of different size: each predictor will explain their own part of the outcome

Predictors, Outcomes and Controls

An effect between a predictor variable and an outcome variable corresponds to the following model:

Predictor Predictor Outcome Outcome Predictor->Outcome

This arrow does not suggest causation but indicate correlation between \(Predictor\) and \(Outcome\), there is no assumption of one causing the other. An “effect” is reciprocal and does not involves causality.

Predictors, Outcomes and Controls

Warning

Causality analysis is an other kind of test that involves:

  • To be sure that 2 variables are correlated
  • That one variable is the antecedent of the other
  • That no other variable is explaining this relationship

Predictors, Outcomes and Controls

A significant effect of a \(Predictor\) on an \(Outcome\) variable means that a predictor is explaining enough variance of the outcome variable.

This shows a significant relationship.

Outcome’s variability is a birthday cake

A significant effect means the slice eat by the predictor is large enough.

Predictors, Outcomes and Controls

If there is no effect between the variables, they are not sharing enough of their variability

If there is a significant effect between the variables, they are sharing a big part of their variability

To decide if the part of the shared variability is big enough, a statistical test is required.

🛠️ Your Turn!

In the research paper you have selected, identify the variables that are used to produce statistical results (e.g. \(p\)-values).

Indicate their Type and Role by using the following table:

variable_name variable_type variable_role
var 1 type role
var n type role

Send me the table by email at damien.dupre@dcu.ie before the next lecture.

4. Literature Review: Formulate your Hypotheses

Hypotheses in a Nutshell

Hypotheses are:

  1. Predictions supported by theory/literature
  2. Affirmations designed to precisely describe the relationships between variables

“Hypothesis statements contain two or more variables that are measurable or potentially measurable and that specify how the variables are related” (Kerlinger, 1986)

Hypotheses in a Nutshell

Hypotheses include:

  • Predictor(s) / Independent Variable(s)
  • Outcome / Dependent Variable (DV)
  • Direction of the outcome if the predictor increases

Warning

Hypothesis cannot test equality between groups or modalities, they can only test differences or effects

Alternative vs. Null Hypotheses

  • Every hypothesis has to state a change (between groups or according values) also called \(H_a\) (for alternative hypothesis) or \(H_1\)

  • Every alternative hypothesis has a null hypothesis counterpart (no difference between groups or according values) also called \(H_0\) (pronounce H naught or H zero)

  • \(H_a\) is viewed as a “challenger” to the null hypothesis \(H_0\).

Statistics are used to estimate the probability of obtaining the observed results, assuming the null hypothesis is correct. If this probability is low, the null hypothesis is rejected and the alternative hypothesis is considered more plausible.

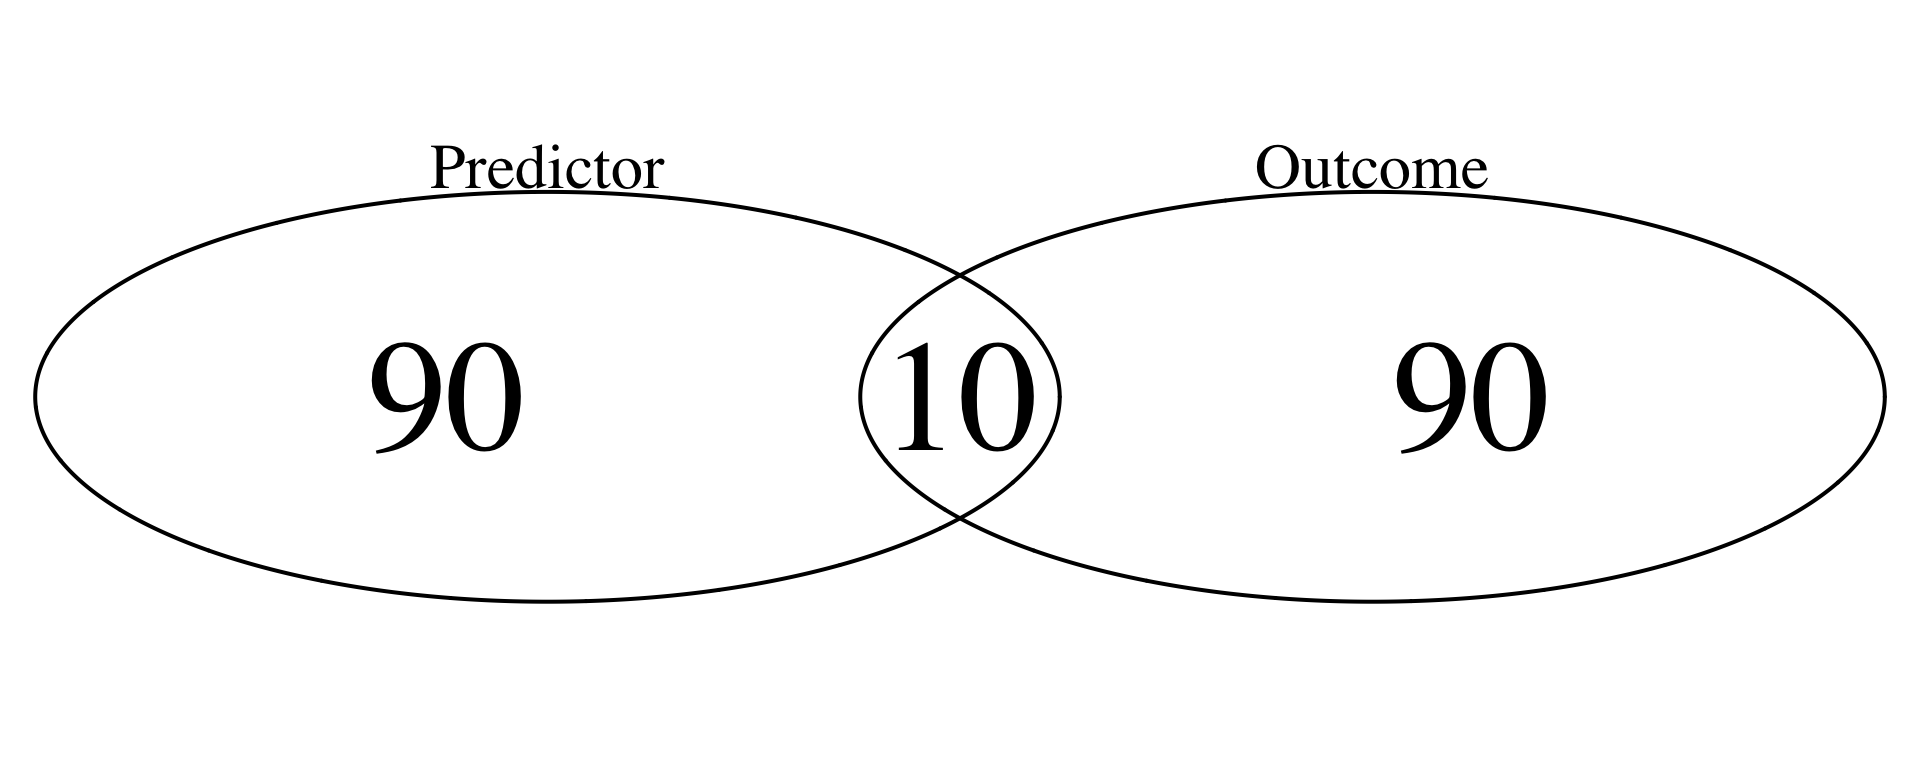
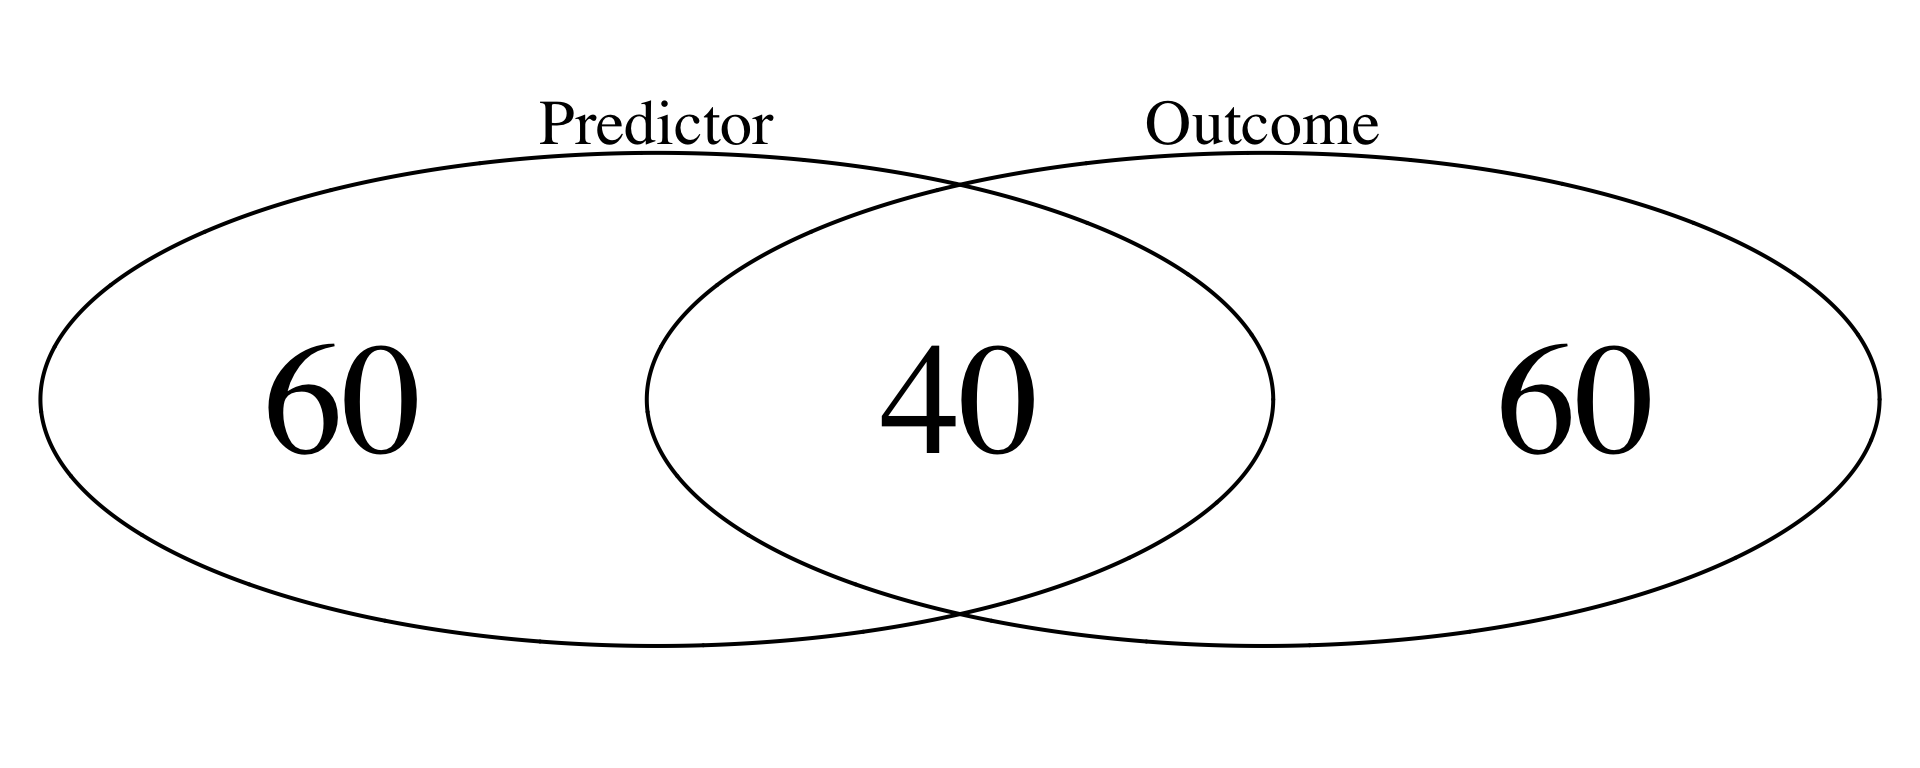
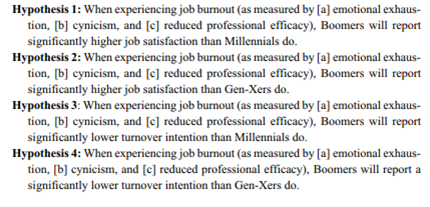
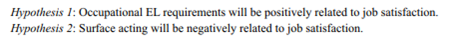
Main Effect Hypothesis…

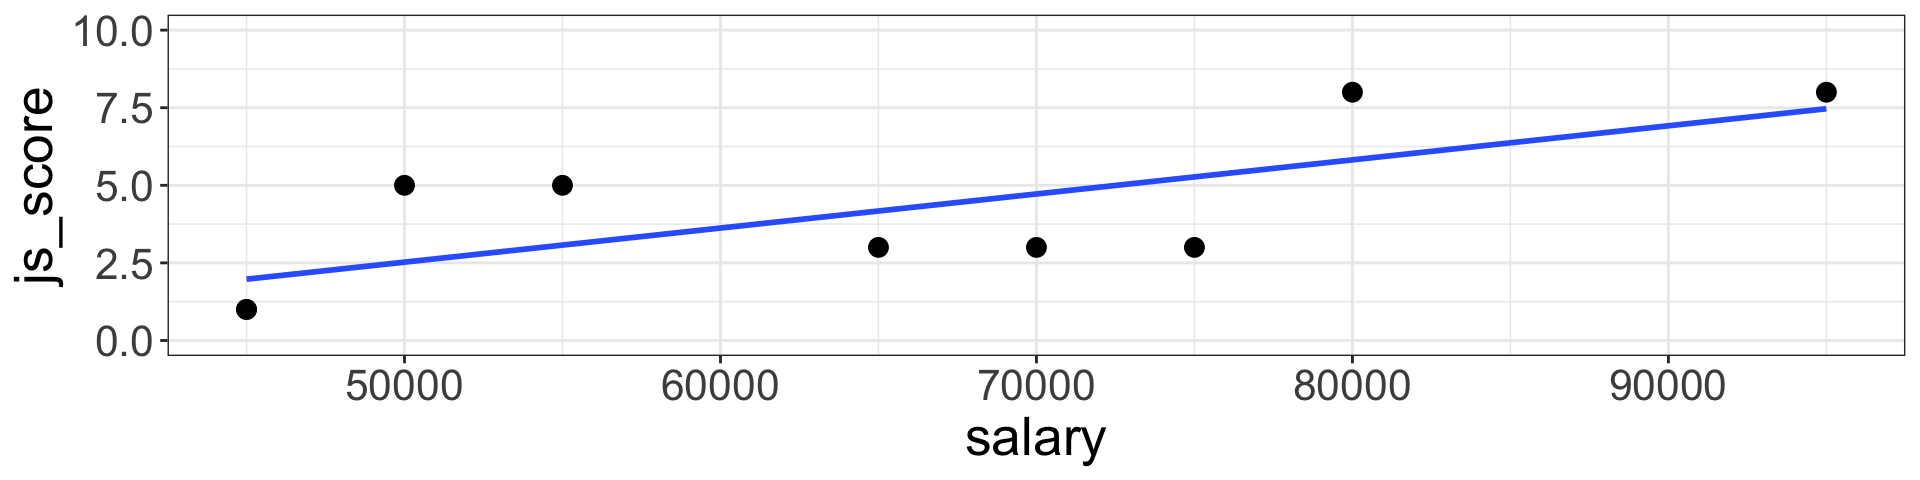
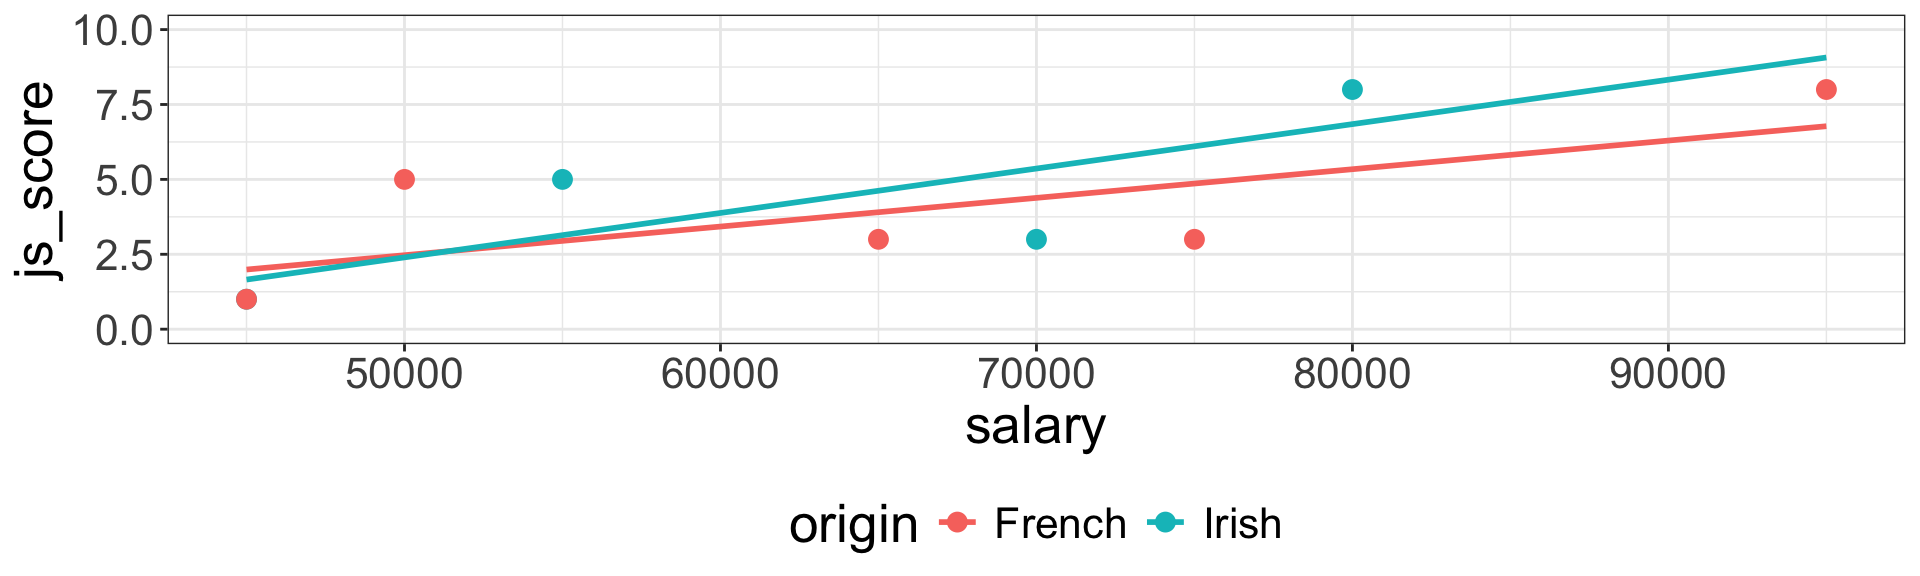
… is the predicted relationship between one \(Predictor\) and one \(Outcome\) variable

  • The \(Outcome\) needs to be Continuous (but some models can use a Categorical Outcome)

  • The \(Predictor\) can be either Continuous or Categorical but the hypothesis formulation will change with its type

Effect representation:

Predictor Predictor Outcome Outcome Predictor->Outcome

Main Effect Hypothesis Templates

How to use a template?

In the following formulation templates, replace the variable names with yours and select the direction of the effect expected.

  • Case 1: Predictor is Continuous

The {outcome} {increases/decreases/changes} when {predictor} increases

Job satisfaction increases when salary increases

Main Effect Hypothesis Templates

How to use a template?

In the following formulation templates, replace the variable names with yours and select the direction of the effect expected.

  • Case 2: Predictor is Categorical (2 Categories)

The {outcome} of {predictor category 1} is {higher/lower/different} than the {outcome} of {predictor category 2}

The Job satisfaction of EU employees is higher than the job satisfaction of non EU employees

Main Effect Hypothesis Templates

How to use a template?

In the following formulation templates, replace the variable names with yours and select the direction of the effect expected.

  • Case 3: Predictor is Categorical (3 or more Categories)

The {outcome} of at least one of the {predictor} is {higher/lower/different} than the {outcome} of the other {predictor}

The Job satisfaction of at least one of the company’s departments is higher than the Job satisfaction of the other company’s departments

Main Effect Hypothesis Examples

  • Outcome = Exam Results (continuous from 0 to 100)
  • Predictor = Sleep Time (continuous from 0h to 24h)

Effect representation:

Sleep Time Sleep Time Exam Results Exam Results Sleep Time->Exam Results

Main Effect Hypothesis:

  • \(H_a\): Exam results increase when students’ sleep time increases

Main Effect Hypothesis Examples

  • Outcome = Exam Results (continuous from 0 to 100)
  • Predictor = Breakfast (categorical yes or no)

Effect representation:

Breakfast Breakfast Exam Results Exam Results Breakfast->Exam Results

Main Effect Hypothesis:

  • \(H_a\): Exam results of students who eat breakfast will be higher than exam results of students who do not eat breakfast

Main Effect Hypothesis Examples

  • Outcome = Driving Errors (continuous from 0 to Inf.)
  • Predictor = Talking on the Phone while Driving (categorical yes/no)

Effect representation:

Talking on the Phone while Driving Talking on the Phone while Driving Driving Errors Driving Errors Talking on the Phone while Driving->Driving Errors

Main Effect Hypothesis:

  • \(H_a\): Driving errors of motorists who do not talk on the phone while driving will be lower than driving errors of motorists who talk on the phone while driving

Interaction Effect Hypothesis

It predicts the influence of a second predictor on the relationship between a first predictor and an outcome variable

Warning

  • The second predictor is also called moderator.
  • The main effect of each predictor must be hypothesised as well
  • The role of first and second predictors can be inverted with the exact same statistical results

Interaction Effect Hypothesis

Effects representation:

Predictor 1 Predictor 1 Predictor 1-> Predictor 2 Predictor 2 Predictor 2-> Outcome Outcome ->Outcome

Exactly the same results:

Predictor 1 Predictor 1 Outcome Outcome Predictor 1->Outcome Predictor 2 Predictor 2 Predictor 2->Outcome Predictor 1 X Predictor 2 Predictor 1 X Predictor 2 Predictor 1 X Predictor 2->Outcome

Interaction Effect Hypothesis

Imagine a first effect where Job Satisfaction increases when Salary increases

This effect can change according to the values of a second predictor

Here, the effect of Salary on Job Satisfaction is higher for Irish employees than it is for French employees because their line is steeper.

Interaction Effect Hypothesis Templates

How to use a template?

In the following formulation templates, replace the variable names with yours and select the direction of the effect expected.

  • Case 1: Predictor 2 is Continuous

The effect of {predictor 1} on {outcome} is {higher/lower/different} when {predictor 2} increases

The effect of Salary on Job Satisfaction is higher when Employees’ Age increases

Interaction Effect Hypothesis Templates

How to use a template?

In the following formulation templates, replace the variable names with yours and select the direction of the effect expected.

  • Case 2: Predictor 2 is Categorical (2 Categories)

The effect of {predictor 1} on {outcome} is {higher/lower/different} for {predictor 2 category 1} than it is for {predictor 2 category 2}

The effect of Salary on Job Satisfaction is higher for Irish employees than it is for French employees

Interaction Effect Hypothesis Templates

How to use a template?

In the following formulation templates, replace the variable names with yours and select the direction of the effect expected.

  • Case 3: Predictor 2 is Categorical (3 or more Categories)

The effect of {predictor 1} on {outcome} is {higher/lower/different} for at least one of {predictor 2}

The effect of Salary on Job Satisfaction is higher for at least one of Employees’ Location

Interaction Effect Hypothesis Examples

  • Outcome = Exam Results (continuous from 0 to 100)
  • Predictor 1 = Sleep Deprivation (categorical low, medium, high)
  • Predictor 2 = Gender (categorical male vs. female)

Effects representation:

Sleep Deprivation Sleep Deprivation Sleep Deprivation-> Exam Results Exam Results Gender Gender Gender-> ->Exam Results

Interaction Effect Hypothesis:

  • \(H_a\): The effect of sleep deprivation on exam results is higher for Males students than it is for Females students

Warning

The main effect hypotheses of the two predictors also have to be formulated

Interaction Effect Hypothesis Examples

  • Outcome = Road Accidents (continuous from 0 to Inf.)
  • Predictor 1 = Alcohol Consumption (continuous from 0 to Inf.)
  • Predictor 2 = Driving Experience (categorical low, high)

Effects representation:

Alcohol Consumption Alcohol Consumption Alcohol Consumption-> Road Accidents Road Accidents Driving Experience Driving Experience Driving Experience-> ->Road Accidents

Interaction Effect Hypothesis:

  • \(H_a\): The effect of alcohol consumption on road accidents is lower for experienced drivers than it is for inexperienced drivers

Warning

The main effect hypotheses of the two predictors also have to be formulated

Example of Hypotheses in Papers

Example of Hypotheses in Papers

The Hypothesis Checklist

When formulating an hypothesis:

  • Is your hypothesis a prediction and not a question?
  • Does your hypothesis include both Predictor and Outcome variables?
  • Are these variables included in your dataset?

Note about hypotheses in academic papers

  • Don’t trust research papers, most of them have incorrect formulations.
  • Use the templates shown previously.

Special Case: Mediation Hypothesis

Remember the birthday cake metaphor: it symbolise the variability of the outcome variable to be explained by the predictors.

Now, imagine one guest take a slice, but the birthday person arrives and take the slice from the guest to eat it.

Special Case: Mediation Hypothesis

A mediation is when a Predictor called mediator, explains part of the variability of the outcome already explained by a first predictor. It is usually used to highlight the influence of psychological features.

Effect representation:

Predictor 1 Predictor 1 Predictor 2 Predictor 2 Predictor 1->Predictor 2 Outcome Outcome Predictor 1->Outcome Predictor 2->Outcome

Special Case: Mediation Hypothesis

Formulation structure:

The effect of {predictor 1} on {outcome} is explained by the {predictor 2}

Warning

A mediation effect involves 3 requirements:

  1. Predictor 1 needs to have a main effect on the Outcome
  2. Predictor 1 needs to have a main effect on the Predictor 2
  3. The main effect of Predictor 1 on the Outcome needs to disappear when Predictor 2 is taken into account

Special Case: Mediation Hypothesis

Example:

  • The effect of employee’s age on job satisfaction is explained by their salary

Here, the requirements are:

  1. Employee’s age needs to have a main effect on job satisfaction
  2. Employee’s age needs to have a main effect on their salary
  3. The main effect of Employee’s age on the job satisfaction needs to disappear when salary is taken into account

Mediation Effect Hypothesis Example

  • Outcome = Happiness (continuous from 0 to 7)
  • Predictor 1 = Exam Results (continuous from 0 to 100)
  • Predictor 2 = Self-Esteem (continuous from 0 to 7)

Self-Esteem Self-Esteem Happiness Happiness Self-Esteem->Happiness Exam Results Exam Results Exam Results->Self-Esteem Exam Results->Happiness

Mediation Effect Hypothesis:

  • \(H_a\): The effect of grades on happiness is explained by self-esteem

🛠️ Your Turn ! Find the variables in these hypotheses

Find the variables in these hypotheses

In the following hypotheses, find the outcome variable and the predictor(s):

  1. Overweight adults who value longevity are more likely than other overweight adults to lose their excess weight

  2. Larger animals of the same species expend more energy than smaller animals of the same type.

  3. Rainbow trout suffer more lice when water levels are low than other trout.

  4. Professors who use a student-centred teaching method will have a greater positive rapport with their graduate students than professors who use a teacher-centred teaching method.

05:00

Solution

Hypothesis 1:

  • Outcome = Excess weight
  • Predictor = The valuation of longevity (yes vs no)

Hypothesis 2:

  • Outcome = Energy expended
  • Predictor = Animal size (larger vs smaller)

Hypothesis 3:

  • Outcome = Suffering lice
  • Predictor = Trout type (rainbow vs other)

Hypothesis 3:

  • Outcome = Rapport with graduate students
  • Predictor = Teaching method (student-centreed vs teacher-centreed)

🛠️ Your Turn ! Make your own Hypothesis

Make your own Hypothesis

Outcome Predictor 1 Predictor 2 Hypothesis Type
Work motivation Gender (Female/Male) Main Effect
Work motivation Gender (Female/Male) Origin (French/Irish) Interaction Effect
Work motivation Gender (Female/Male) Origin (French/Irish/Italian) Interaction Effect
Job satisfaction Stress (0 to 10) Main Effect
Job satisfaction Stress (0 to 10) Age (Millennials/Baby Boomers) Interaction Effect
Job satisfaction Stress (0 to 10) Age (in years) Interaction Effect
05:00

Solution

  1. The work motivation of female employees is higher than the work motivation of male employees
  2. The effect of gender on work motivation is higher for Irish employees than it is for French employees
  3. The effect of employee origin on work motivation is higher for female employees than it is for male employees
  4. Job satisfaction decreases when stress increases
  5. The effect of stress on job satisfaction is higher for Millennials than it is for Baby boomers
  6. The effect of stress on job satisfaction increases when employee’s age increases

Homework Exercise

In the research paper that you have selected, formulate the tested hypotheses using the templates seen in the slide of the lecture and the variables that you have previously determined

Send me your hypotheses by email at damien.dupre@dcu.ie before the next lecture.


Thanks for your attention

and don’t hesitate to ask if you have any questions!